
Morphological characteristics and health status of 8–19-year old girls
Proceeding Book of the International Scientific Congress “Applied Sports Sciences”, Volume 2, 265–271 · DOI 10.37393/ICASS2022/116
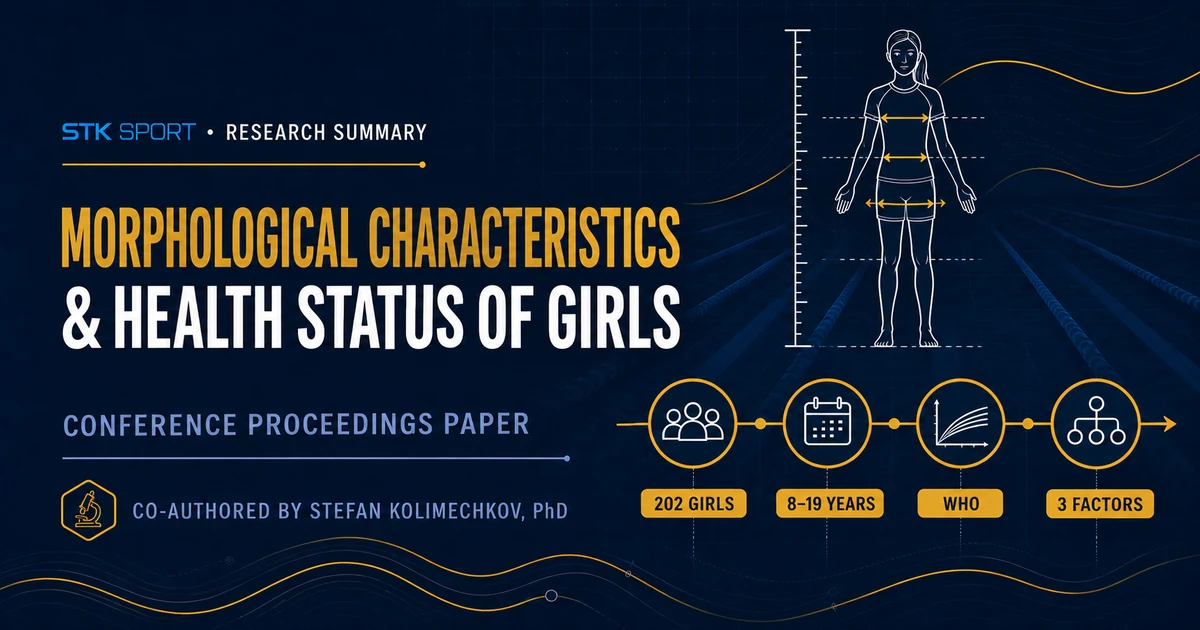
Children’s health assessment benefits from examining the pattern across several body-composition measures.
Body height, weight and BMI are widely used to monitor growth, but BMI does not distinguish fat mass from fat-free tissue or show where body fat is distributed. Measures such as waist-to-hip ratio, body-fat percentage, skeletal muscle mass and total body water add complementary information.
This study assessed girls aged 8 to 19 and used principal component analysis to identify how the recorded anthropometric, morphological and metabolic variables grouped together.
Which groups of body-composition variables contributed most strongly to the profile observed in these girls?
They combined standardised measurements with a multi-variable analysis of body composition.
The cross-sectional study included 202 girls aged 8 to 19 from different schools in Sofia. The sample had a mean age of 12.1 ± 3.5 years, mean height of 150.1 ± 15.0 cm and mean BMI of 18.8 ± 4.0 kg/m2.
Parents provided informed consent. Measurements took place in the morning on an empty stomach, with participants barefoot and wearing shorts and T-shirts, at the National Sports Academy’s sports laboratory.
- Recruit 202 girlsParticipants aged 8 to 19 from schools in Sofia
- Measure heightRecorded to the nearest 0.1 cm using a SECA height measure
- Assess body compositionInBody120 segmental multi-frequency bioelectrical impedance analysis
- Analyse the patternWHO BMI-for-age classification and principal component factor analysis
Growth and weight-status indicators
Height, weight, BMI, waist-to-hip ratio, growth score and obesity degree were recorded. BMI Z-scores were evaluated against WHO references for ages 5 to 19.
Fat, lean tissue and water
The InBody120 assessment provided body-fat mass and percentage, fat-free mass, skeletal muscle mass, total body water, protein, minerals and estimated basal metabolic rate.
Principal component factor analysis
The researchers used a rotated component matrix with Varimax and Kaiser normalisation to identify clusters among the recorded variables, using body height as the selection variable.
Obesity-related measures formed the strongest component in the body-composition profile.
The analysis grouped the recorded variables into three components: anthropometric parameters of obesity, morphological characteristics, and age and metabolism. Together they explained 95.48% of variance in the dataset.
Most participants were within the normal BMI-for-age category
WHO BMI Z-scores classified 73.8% of the girls as normal weight, 17.3% as overweight, 5.4% as obese and 3.5% as thin.
Obesity-related measures explained about 59% of variance
The first component included BMI, weight, body-fat mass, body-fat percentage, waist-to-hip ratio, growth score and obesity degree. The results table reports 59.2% of explained variance.
Lean-tissue measures and metabolism formed distinct groups
Morphological characteristics—protein, minerals, fat-free mass and skeletal muscle mass—accounted for 29.6%. Age, total body water and basal metabolic rate accounted for 6.6%.
Waist-to-hip ratio identified context not visible from BMI alone
The paper reports that 21 girls, around 10% of the sample, met its threshold for abdominal obesity while also having a normal BMI.
One in five girls aged 8–11 was overweight or obese
Within this age group, 13% were classified as overweight and 7% as obese; 77% were in the normal category and 3% were thin.
Seventeen per cent of girls aged 12–19 were overweight
The paper reports around 80% in the normal category, 17% overweight, 2.4% thin and no participants classified as obese in this subgroup.
Several measures together can provide a more informative body-composition profile than BMI alone.
The study’s main value is not a single threshold. It is the demonstration that fat-related, lean-tissue and metabolic variables form different but connected dimensions that may help practitioners interpret growth and body composition more carefully.
Complementary measures can strengthen monitoring
Where appropriately trained staff and suitable equipment are available, combining BMI-for-age with fat distribution and body-composition measures may help place an individual result in broader context.
An exploratory cross-sectional sample
- The participants were an accessible sample of girls from schools in Sofia, so the percentages should not be treated as national prevalence estimates.
- The broad age range captures different stages of growth and maturation within one cross-sectional assessment.
- The factor structure is specific to the recorded variables, analysis and sample and requires confirmation in other populations.
No diagnosis or causal explanation
- The study does not show that one body-composition variable caused another or caused later health outcomes.
- BMI, waist-to-hip ratio and bioelectrical-impedance outputs are assessment indicators, not standalone diagnoses.
- The findings do not define one ideal body composition for every girl aged 8 to 19.
Read and cite the paper.
Use the registered DOI or read the complete paper hosted on STK SPORT.
Bonova, I., Mileva, E., & Kolimechkov, S. (2022). Morphological characteristics and health status of 8-19-year old girls. In T. Iancheva, S. Djobova, & M. Kuleva (Eds.), Proceeding Book of the International Scientific Congress “Applied Sports Sciences” (Vol. 2, pp. 265–271). Sofia, Bulgaria: Scientific Publishing House NSA Press. https://doi.org/10.37393/ICASS2022/116