
Norm-referenced percentile values for physical fitness in Apulian children: findings from the SBAM! regional project
Sport Mont, 24(2), 37–48 · DOI 10.26773/smj.260606
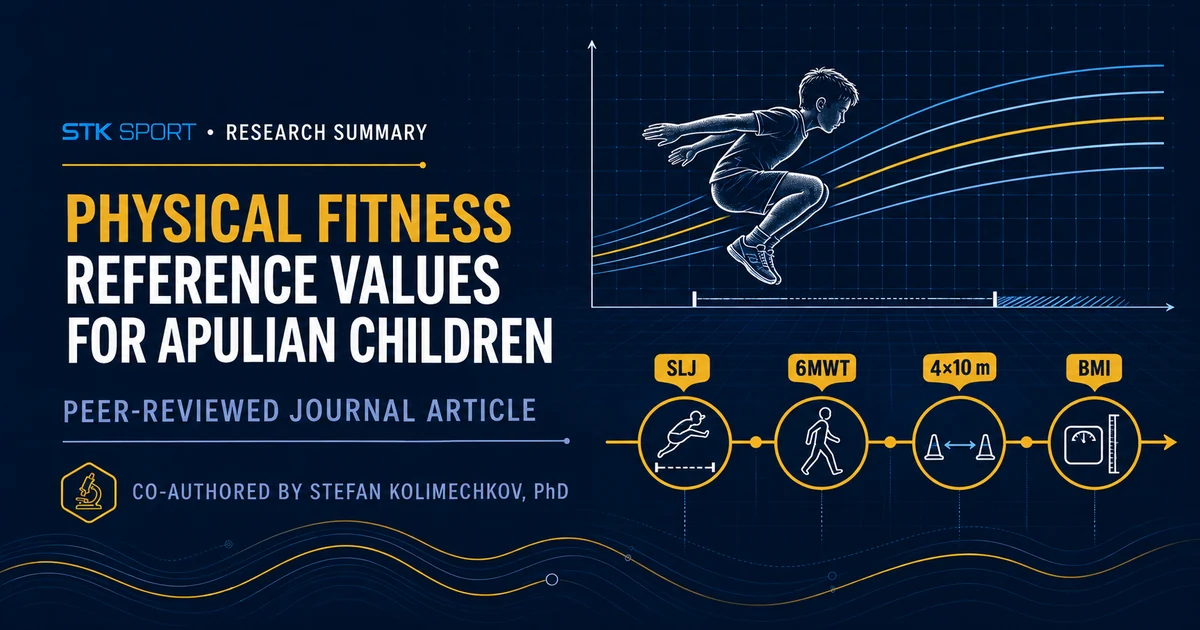
What does physical fitness look like across a large regional sample of primary-school children?
National or international norms can be informative, but they may conceal local differences in opportunity, environment and health. Apulia also reports substantial levels of childhood overweight and obesity, increasing the value of practical school-based surveillance.
The SBAM! project brought together schools, universities and regional organisations to establish age- and sex-referenced percentile values across all six Apulian provinces.
Can a large school-based dataset provide practical regional benchmarks for children’s fitness and anthropometric characteristics?
A large cross-sectional fitness assessment across six Apulian provinces.
Data were collected from November 2024 to June 2025 through 130 schools and 623 primary-school classes. After data cleaning, 9,777 children aged 8–9 years were included.
The project produced percentile references for the assessed population. It did not follow individual children over time or test an intervention.
- Regional sample10,330 children initially assessed across six provinces
- Field testsFour measures collected in the school setting
- Data cleaning553 incomplete or outlying records excluded
- Reference modellingPercentiles, group comparisons and PCA calculated
Four practical field measures
Height and weight were used to calculate BMI. Fitness was assessed with standing long jump, six-minute walking distance and the 4×10 m shuttle run.
Sex-specific reference curves
The LMS method modelled the 1st, 5th, 10th, 25th, 50th, 75th, 90th, 95th and 99th percentiles separately for boys and girls.
Age, sex and province examined
MANOVA and robust ANOVAs tested group differences. Principal component analysis explored whether the measures formed broader fitness and anthropometric dimensions.
A regional percentile framework with broadly similar fitness profiles across Apulia.
The study established detailed reference curves while showing that many statistically detectable group differences were very small in practical magnitude.
Detailed percentile references were produced
Sex- and age-referenced curves were estimated from the 1st to the 99th percentile for BMI, standing long jump, six-minute walking distance and shuttle-run time.
Age predicted all four measures
Age group was statistically associated with BMI and each fitness test. The largest reported effect was still small and involved standing long jump (ω² = 0.02); effects for the other measures were very small.
Boys and girls showed comparable profiles
Standing-long-jump performance differed statistically by sex, but the effect size was very small (ω² = 0.001). BMI and the other fitness tests were largely similar between boys and girls.
Provincial effects were very small
Some province-related effects reached statistical significance, but their magnitude was about ω² = 0.001, indicating broadly homogeneous outcomes across Apulia.
Fitness and BMI formed two dimensions
Principal component analysis separated standing long jump, walking distance and shuttle-run performance from BMI. The two components explained 61.37% of total variance in the full sample.
Results aligned with other reference datasets
The authors reported that the Apulian values were broadly comparable with published Italian, European and non-European reference data.
A practical regional reference for schools, researchers and policy teams.
The study’s principal contribution is a large, locally relevant percentile framework. It can support consistent fitness surveillance and help regional organisations decide where more assessment or physical-education support may be useful.
Benchmarks for regional monitoring
Schools and regional teams may use the percentiles as one reference point when reviewing group-level fitness patterns, planning physical education and considering where additional assessment could be valuable.
A strong dataset with defined boundaries
The cross-sectional study cannot show change over time. Provincial subgroup sizes were uneven, and excluding values beyond ±2 SD may have reduced the precision of the most extreme percentiles. The assessment covered three fitness tests and BMI rather than every fitness component.
Percentiles are not a diagnosis
- The results do not establish cause-and-effect relationships or individual fitness trajectories.
- The references apply to the assessed 8–9-year-old Apulian population, not automatically to every child or region.
- A percentile position alone does not diagnose health or determine the quality of a child’s physical education.
Read and cite the paper.
Use the verified DOI or read the complete open-access article hosted on STK SPORT.
Monacis, D., Bibba, M., Colella, D., & Kolimechkov, S. (2026). Norm-referenced percentile values for physical fitness in Apulian children: Findings from the SBAM! regional project. Sport Mont, 24(2), 37–48. https://doi.org/10.26773/smj.260606