Alpha-Fit Test Battery Norms for Children and Adolescents From 5 To 18 Years of Age Obtained by A Linear Interpolation of Existing European Physical Fitness References
Stefan Kolimechkov, Lubomir Petrov & Albena Alexandrova
How to cite:
Kolimechkov, S., Petrov, L., & Alexandrova, A. (2019). Alpha-fit test battery norms for children and adolescents from 5 to 18 years of age obtained by a linear interpolation of existing European physical fitness references. European Journal of Physical Education and Sport Science, 5(4), 1-14.

European Journal of
Physical Education and Sport Science
 Romania, Open Access Publishing Group
061231, Bucharest, Moinest Street, Nr. 40
e-mail: editor@oapub.org | website: www.oapub.org
ABOUT THE JOURNAL
The European Journal of Physical Education and Sport Science (ISSN 2501 - 1235) is one of the European Journals of Education Studies and it is a registered trademark of the Open Access Publishing Group. This journal publishes research in the fields of education, sport, physical activity, and sports psychology.
ABOUT THIS ARTICLE
This study provides the very first full set of Alpha-fit physical fitness norms for children and adolescents. The proposed combined and interpolated reference values can be applied in order to evaluate European children and adolescents at all ages. This study was originally presented in the parallel sessions at the 13th European & 29th World FIEP Congress in Istanbul, Turkey, in 2018. After the FIEP Congress, the study was built upon further and the complete article was accepted in the European Journal of Physical Education and Sport Science, in January 2019, and it is now available for download on this page.
This research was financially supported by Grant ‘08/15.02.2018’ from the National Sports Academy, Sofia, Bulgaria.
Alpha-fit test battery norms for children and adolescents from 5 to 18 years of age obtained by a linear interpolation of existing European physical fitness references
Published Journal Article

European Journal of Physical Education and Sport Science
Vol. 5, Issue 4, January 2019, pp. 1-14, DOI: 10.5281/zenodo.2546360 ISSN: 2501 - 1235
ALPHA-FIT TEST BATTERY NORMS FOR CHILDREN AND ADOLESCENTS FROM 5 TO 18 YEARS OF AGE OBTAINED BY A LINEAR INTERPOLATION OF EXISTING EUROPEAN PHYSICAL FITNESS REFERENCES
Stefan Kolimechkov, Lubomir Petrov & Albena Alexandrova
Elite Gymnastics Academy CIC, London, United Kingdom
Department of Physiology and Biochemistry, National Sports Academy, Sofia, Bulgaria
ABSTRACT
Physical fitness has been shown to be a major health factor in both children and adolescents. One of the most widely applied physical fitness test batteries in Europe is the Alpha-fit. However, there is a reference gap between some of the ages. The aim of this study was to propose interpolated physical fitness percentile scores in children and adolescents for the main tests in the Alpha-fit test battery, which can be temporarily applied until this gap is filled in by experimental research. The recently available existing European normative values for children and adolescents were linearly interpolated in order to propose percentile scores to close the gap from 9.9 to 12.9 years of age in relation to the following tests: handgrip strength, standing long jump, and 4x10m shuttle run test (SRT). Similarly, other international references were combined with regard to the 20m SRT in order, thereby, to produce a full set of norms with the appropriate interpolations. The interpolated percentile scores obtained can be applied to assess the results from the Alpha-fit test battery of children and adolescents from 5 to 18 years of age. The combined percentile curves for handgrip strength, standing long jump, 4x10m SRT, and 20m SRT showed linearity, which sharpens between the ages of 9 and 13, and is probably connected with puberty. The proposed combined and interpolated reference values can be applied in order to evaluate European children and adolescents of all ages until the missing values are established by experimental research.
Keywords: Alpha-fit, physical fitness, references, percentile scores, norms
1. INTRODUCTION
Physical fitness is a major health factor in both children and adolescents (Cvejic, T. Pejovic, & Ostojic, 2013; Ganley et al., 2011; Kolimechkov, 2017; F. B. Ortega, Ruiz, Castillo, & Sjostrom, 2008; Ruiz et al., 2010). Currently, there are more than fifteen fieldbased physical fitness test batteries for assessing children and adolescents worldwide (Castro-Pinero. J. et al., 2009; Cvejic et al., 2013; Kolimechkov, 2017; Ruiz et al., 2010), and one of the most widely applied in Europe is the Alpha-fit (Cvejic et al., 2013; Kolimechkov, 2017; Ruiz et al., 2010). This battery focuses on the main components of physical fitness which are concerned with children’s health, and in accordance with many authors and based on solid scientific evidence, as well as many longitudinal and cross-sectional studies, Alpha-fit is a valid, reliable, feasible and safe health-related test battery (ALPHA, 2009; Ruiz et al., 2010; Santos & Mota, 2011). Moreover, some authors even present Alpha-fit as an ideal instrument of field based tests for assessing healthrelated physical fitness in children and adolescents (Cvejic et al., 2013).
Gender- and age-specific fitness reference norms are used in order to classify the level of physical fitness in children, as well as to monitor the fitness status of the population. Although physical fitness references have been reported in Spain and some other European countries, harmonised normative values applicable throughout Europe are needed for children and adolescents (F. Ortega et al., 2011). In 2011, Ortega et al. established European physical fitness percentiles for adolescents between the ages of 13 and 17 in the HELENA study (Healthy Lifestyle in Europe by Nutrition in Adolescence), which enabled the evaluation and correct interpretation of their fitness status (F. Ortega et al., 2011). European physical fitness percentiles in children between the ages of 6 and 9 were obtained for the first time in the IDEFICS study (identification and prevention of dietary and lifestyle-induced health effects in children and infants) by Miguel-Etayo et al. in 2014 (Miguel-Etayo et al., 2014). Unfortunately, there is still a reference gap between 9.9 and 12.9 years without percentile scores in the European published norms for handgrip strength, standing long jump, 4x10m shuttle run tests (4x10m SRT), and 20m shuttle run test (20m SRT), which has to be filled in (MiguelEtayo et al., 2014), in order to appropriately assess children’s physical fitness.
Therefore, the aim of this study was to propose physical fitness percentile scores for the main tests in the Alpha-fit test battery, obtained by a linear interpolation of existing European physical fitness references, which can be temporarily applied until this gap is filled in by experimental research.
2. MATERIAL AND METHODS
The available European normative values for children, from 6 to 9 years of age, published by Miguel-Etayo et al., 2014, and for adolescents, from 13 to 17 years of age, published by Ortega et al., 2011, in relation to the aforementioned tests (handgrip strength, standing long jump, and 4x10m SRT) of the Alpha-fit test battery were linearly interpolated in order to propose percentile scores to close the gap from 9.9 to 12.9 years of age. Moreover, percentile scores for those of 5 and 18 years of age were also estimated by extrapolation. In addition, percentiles which were not given with the published norms (20th, 30th, 40th, 60th, 70th, 80th, and 100th in children, and the 1st, 3rd, 25th, 75th, 97th, and 99th in adolescents) were also interpolated.
With regard to the maximal oxygen uptake (VO2max) obtained by the 20m SRT, the available European normative values supplied by Miguel-Etayo et al., 2014 for children from 6 to 9 years of age, and international norms in children and adolescents between the ages of 9 and 17, as published by Tomkinson et al., 2016, were combined in order, thereby, to produce a full set of recent percentile scores with the appropriate interpolations. Percentile scores for those of 5 and 18 years of age were also estimated by extrapolation, as for the other three tests.
3. RESULTS
The interpolated percentile scores obtained for the main tests of the Alpha-fit test battery, for children and adolescents from 5 to 18 years of age, are presented in Tables 1-8. The original existing percentile scores are given in bold, and the interpolated values are presented in italics.
Table 1: Percentiles for the handgrip strength (kg) in girls
(Average of right and left handgrip strength)
|
Percentiles |
|||||||||||||||
Age |
1 |
3 |
10 |
20 |
25 |
30 |
40 |
50 |
60 |
70 |
75 |
80 |
90 |
97 |
99 |
100 |
5.0 |
4.2 |
4.5 |
5.0 |
5.3 |
5.4 |
5.6 |
5.9 |
6.3 |
6.7 |
7.1 |
7.3 |
7.7 |
8.4 |
10.1 |
10.8 |
11.2 |
6.0 |
5.0 |
5.5 |
6.2 |
6.7 |
7.0 |
7.2 |
7.7 |
8.1 |
8.6 |
9.1 |
9.3 |
9.7 |
10.6 |
12.1 |
13.2 |
13.8 |
6.5 |
5.4 |
6.0 |
6.8 |
7.5 |
7.8 |
8.0 |
8.5 |
9.0 |
9.5 |
10.0 |
10.3 |
10.8 |
11.7 |
13.1 |
14.4 |
15.1 |
7.0 |
5.8 |
6.4 |
7.4 |
8.1 |
8.5 |
8.8 |
9.3 |
9.8 |
10.4 |
10.9 |
11.2 |
11.7 |
12.7 |
14.2 |
15.4 |
16.0 |
7.5 |
6.1 |
6.9 |
8.0 |
8.8 |
9.2 |
9.5 |
10.0 |
10.6 |
11.2 |
11.9 |
12.2 |
12.7 |
13.7 |
15.3 |
16.5 |
17.1 |
8.0 |
6.5 |
7.3 |
8.6 |
9.5 |
9.9 |
10.2 |
10.9 |
11.5 |
12.1 |
12.8 |
13.1 |
13.6 |
14.7 |
16.3 |
17.6 |
18.3 |
8.5 |
6.7 |
7.7 |
9.1 |
10.1 |
10.6 |
10.9 |
11.6 |
12.3 |
13.0 |
13.7 |
14.1 |
14.6 |
15.7 |
17.4 |
18.6 |
19.2 |
9.0 |
7.8 |
8.7 |
10.1 |
11.2 |
11.7 |
12.1 |
12.8 |
13.6 |
14.3 |
15.1 |
15.5 |
16.1 |
17.3 |
19.2 |
20.4 |
21.0 |
10.0 |
10.0 |
10.7 |
12.1 |
13.4 |
13.9 |
14.4 |
15.2 |
16.1 |
16.9 |
17.8 |
18.3 |
19.0 |
20.4 |
22.8 |
24.0 |
24.6 |
11.0 |
12.1 |
12.8 |
14.1 |
15.5 |
16.2 |
16.7 |
17.7 |
18.6 |
19.6 |
20.6 |
21.2 |
21.8 |
23.5 |
26.4 |
27.6 |
28.1 |
12.0 |
14.3 |
14.8 |
16.1 |
17.7 |
18.4 |
19.0 |
20.1 |
21.1 |
22.2 |
23.3 |
24.0 |
24.7 |
26.7 |
30.0 |
31.2 |
31.7 |
13.0 |
16.5 |
16.8 |
18.1 |
19.9 |
20.6 |
21.3 |
22.5 |
23.6 |
24.8 |
26.0 |
26.8 |
27.6 |
29.8 |
33.7 |
34.8 |
35.3 |
14.0 |
18.3 |
18.6 |
19.8 |
21.5 |
22.2 |
22.9 |
24.1 |
25.2 |
26.4 |
27.7 |
28.5 |
29.2 |
31.5 |
35.4 |
36.5 |
37.1 |
15.0 |
19.1 |
19.4 |
20.7 |
22.5 |
23.2 |
23.9 |
25.1 |
26.2 |
27.4 |
28.7 |
29.5 |
30.3 |
32.6 |
36.7 |
37.9 |
38.5 |
16.0 |
19.7 |
20.0 |
21.2 |
22.9 |
23.6 |
24.3 |
25.4 |
26.6 |
27.8 |
29.1 |
30.0 |
30.8 |
33.2 |
37.8 |
39.1 |
39.7 |
17.0 |
20.7 |
21.0 |
22.2 |
23.9 |
24.6 |
25.2 |
26.4 |
27.6 |
28.9 |
30.3 |
31.2 |
32.1 |
34.8 |
40.3 |
41.9 |
42.7 |
18.0 |
21.7 |
22.0 |
23.2 |
24.9 |
25.5 |
26.1 |
27.4 |
28.6 |
30.0 |
31.5 |
32.5 |
33.4 |
36.4 |
42.9 |
44.8 |
45.7 |
Table 2: Percentiles for the handgrip strength (kg) in boys
(Average of right and left handgrip strength)
Percentiles |
||||||||||||||||
Age |
1 |
3 |
10 |
20 |
25 |
30 |
40 |
50 |
60 |
70 |
75 |
80 |
90 |
97 |
99 |
100 |
5.0 |
4.4 |
4.8 |
5.5 |
6.0 |
6.3 |
6.5 |
6.9 |
7.3 |
7.7 |
8.2 |
8.4 |
8.8 |
9.5 |
10.4 |
11.5 |
12.1 |
6.0 |
5.4 |
6.0 |
6.9 |
7.6 |
7.9 |
8.1 |
8.6 |
9.1 |
9.6 |
10.1 |
10.4 |
10.8 |
11.7 |
13.0 |
14.1 |
14.7 |
6.5 |
5.9 |
6.6 |
7.6 |
8.3 |
8.7 |
9.0 |
9.5 |
10.0 |
10.6 |
11.1 |
11.4 |
11.9 |
12.8 |
14.3 |
15.4 |
16.0 |
7.0 |
6.4 |
7.2 |
8.3 |
9.0 |
9.4 |
9.7 |
10.3 |
10.9 |
11.5 |
12.1 |
12.4 |
12.9 |
13.9 |
15.5 |
16.8 |
17.5 |
7.5 |
7.0 |
7.8 |
8.9 |
9.8 |
10.2 |
10.5 |
11.1 |
11.7 |
12.4 |
13.1 |
13.4 |
14.0 |
15.1 |
16.8 |
18.1 |
18.8 |
8.0 |
7.5 |
8.3 |
9.6 |
10.5 |
11.0 |
11.3 |
12.0 |
12.6 |
13.3 |
14.0 |
14.4 |
15.0 |
16.2 |
18.0 |
19.5 |
20.3 |
8.5 |
8.0 |
8.9 |
10.3 |
11.2 |
11.7 |
12.1 |
12.8 |
13.5 |
14.3 |
15.0 |
15.4 |
16.0 |
17.3 |
19.3 |
20.8 |
21.6 |
9.0 |
9.0 |
9.9 |
11.3 |
12.4 |
12.9 |
13.3 |
14.1 |
14.9 |
15.8 |
16.6 |
17.1 |
17.8 |
19.3 |
21.8 |
23.3 |
24.1 |
10.0 |
11.1 |
11.8 |
13.3 |
14.6 |
15.2 |
15.7 |
16.8 |
17.7 |
18.8 |
19.9 |
20.5 |
21.3 |
23.2 |
26.7 |
28.3 |
29.1 |
11.0 |
13.1 |
13.8 |
15.2 |
16.9 |
17.6 |
18.2 |
19.4 |
20.6 |
21.8 |
23.1 |
23.9 |
24.8 |
27.2 |
31.6 |
33.2 |
34.1 |
12.0 |
15.2 |
15.7 |
17.2 |
19.1 |
19.9 |
20.6 |
22.1 |
23.4 |
24.8 |
26.4 |
27.3 |
28.3 |
31.1 |
36.5 |
38.2 |
39.1 |
13.0 |
17.2 |
17.7 |
19.2 |
21.4 |
22.3 |
23.1 |
24.7 |
26.2 |
27.8 |
29.6 |
30.7 |
31.8 |
35.1 |
41.4 |
43.2 |
44.1 |
14.0 |
20.8 |
21.4 |
23.4 |
26.3 |
27.4 |
28.5 |
30.4 |
32.2 |
34.0 |
36.1 |
37.3 |
38.5 |
42.0 |
48.1 |
49.8 |
50.7 |
15.0 |
25.2 |
25.9 |
28.1 |
31.3 |
32.5 |
33.7 |
35.7 |
37.7 |
39.7 |
41.8 |
43.1 |
44.3 |
47.9 |
54.0 |
55.7 |
56.6 |
16.0 |
30.4 |
31.0 |
33.0 |
35.9 |
37.0 |
38.1 |
40.0 |
41.8 |
43.7 |
45.7 |
46.9 |
48.1 |
51.5 |
57.5 |
59.2 |
60.0 |
17.0 |
35.2 |
35.7 |
37.4 |
39.9 |
40.9 |
41.8 |
43.5 |
45.1 |
46.7 |
48.5 |
49.6 |
50.6 |
53.7 |
59.2 |
60.7 |
61.5 |
18.0 |
39.9 |
40.3 |
41.8 |
43.9 |
44.7 |
45.5 |
47.0 |
48.4 |
49.7 |
51.3 |
52.2 |
53.1 |
55.9 |
60.9 |
62.3 |
63.0 |
Table 3. Percentiles for the standing long jump test (cm) in girls
Percentiles |
||||||||||||||||
Age |
1 |
3 |
10 |
20 |
25 |
30 |
40 |
50 |
60 |
70 |
75 |
80 |
90 |
97 |
99 |
100 |
5.0 |
37.9 |
47.8 |
60.1 |
68.0 |
71.9 |
74.4 |
79.3 |
84.2 |
89.0 |
93.7 |
96.1 |
99.5 |
106.3 |
116.4 |
123.4 |
126.9 |
6.0 |
46.7 |
56.6 |
69.1 |
77.1 |
81.1 |
83.6 |
88.7 |
93.8 |
98.7 |
103.6 |
106.1 |
109.6 |
116.7 |
127.0 |
134.4 |
138.1 |
6.5 |
51.1 |
61.0 |
73.6 |
81.7 |
85.7 |
88.3 |
93.4 |
98.6 |
103.6 |
108.6 |
111.1 |
114.7 |
121.9 |
132.3 |
139.9 |
143.7 |
7.0 |
55.6 |
65.5 |
78.2 |
86.3 |
90.4 |
93.0 |
98.3 |
103.5 |
108.5 |
113.5 |
116.0 |
119.7 |
127.0 |
137.6 |
145.2 |
149.0 |
7.5 |
60.2 |
70.1 |
82.8 |
91.1 |
95.2 |
97.8 |
103.1 |
108.3 |
113.4 |
118.5 |
121.0 |
124.7 |
132.1 |
142.7 |
150.5 |
154.4 |
8.0 |
64.9 |
74.8 |
87.5 |
95.8 |
99.9 |
102.5 |
107.8 |
113.1 |
118.2 |
123.3 |
125.9 |
129.6 |
137.1 |
147.9 |
155.7 |
159.6 |
8.5 |
69.6 |
79.5 |
92.3 |
100.6 |
104.7 |
107.4 |
112.7 |
118.0 |
123.1 |
128.2 |
130.8 |
134.6 |
142.1 |
152.9 |
160.8 |
164.8 |
9.0 |
72.6 |
81.7 |
93.9 |
102.5 |
106.6 |
109.5 |
115.0 |
120.5 |
125.8 |
131.2 |
134.0 |
137.8 |
145.9 |
158.0 |
165.7 |
169.5 |
10.0 |
78.7 |
86.1 |
97.2 |
106.4 |
110.5 |
113.7 |
119.6 |
125.4 |
131.1 |
137.1 |
140.3 |
144.3 |
153.5 |
168.1 |
175.4 |
179.1 |
11.0 |
84.8 |
90.5 |
100.5 |
110.3 |
114.4 |
117.9 |
124.2 |
130.4 |
136.5 |
143.0 |
146.6 |
150.8 |
161.2 |
178.2 |
185.2 |
188.7 |
12.0 |
90.9 |
94.8 |
103.7 |
114.2 |
118.3 |
122.1 |
128.9 |
135.3 |
141.8 |
148.9 |
152.9 |
157.2 |
168.8 |
188.3 |
194.9 |
198.2 |
13.0 |
97.0 |
99.2 |
107.0 |
118.1 |
122.2 |
126.3 |
133.5 |
140.3 |
147.2 |
154.8 |
159.3 |
163.7 |
176.4 |
198.4 |
204.7 |
207.8 |
14.0 |
100.1 |
102.4 |
110.4 |
121.8 |
126.0 |
130.2 |
137.4 |
144.2 |
151.1 |
158.5 |
162.9 |
167.3 |
179.6 |
200.4 |
206.3 |
209.3 |
15.0 |
101.3 |
103.6 |
111.6 |
123.0 |
127.2 |
131.3 |
138.3 |
145.0 |
151.7 |
158.8 |
163.0 |
167.2 |
179.0 |
198.7 |
204.3 |
207.1 |
16.0 |
104.7 |
107.0 |
114.8 |
126.0 |
130.1 |
134.1 |
141.0 |
147.5 |
154.0 |
160.9 |
165.0 |
169.1 |
180.4 |
199.4 |
204.8 |
207.5 |
17.0 |
108.8 |
111.0 |
118.6 |
129.5 |
133.5 |
137.4 |
144.2 |
150.6 |
157.0 |
163.9 |
168.0 |
172.0 |
183.4 |
202.5 |
208.0 |
210.7 |
18.0 |
112.9 |
115.0 |
122.4 |
133.0 |
136.9 |
140.7 |
147.4 |
153.7 |
160.0 |
166.9 |
170.9 |
174.9 |
186.4 |
205.7 |
211.2 |
213.9 |
Table 4. Percentiles for the standing long jump test (cm) in boys
Percentiles |
||||||||||||||||
Age |
1 |
3 |
10 |
20 |
25 |
30 |
40 |
50 |
60 |
70 |
75 |
80 |
90 |
97 |
99 |
100 |
5.0 |
42.8 |
54.3 |
67.7 |
76.0 |
80.2 |
82.8 |
87.9 |
93.0 |
97.6 |
102.1 |
104.4 |
107.8 |
114.5 |
123.5 |
130.2 |
133.6 |
6.0 |
52.0 |
63.5 |
77.3 |
85.8 |
90.0 |
92.6 |
97.8 |
103.0 |
107.8 |
112.6 |
115.0 |
118.4 |
125.3 |
134.9 |
141.8 |
145.3 |
6.5 |
56.6 |
68.1 |
82.1 |
90.6 |
94.9 |
97.5 |
102.8 |
108.0 |
112.9 |
117.8 |
120.3 |
123.8 |
130.7 |
140.6 |
147.6 |
151.1 |
7.0 |
61.3 |
72.8 |
86.8 |
95.5 |
99.8 |
102.5 |
107.8 |
113.1 |
118.1 |
123.1 |
125.6 |
129.1 |
136.2 |
146.2 |
153.4 |
157.0 |
7.5 |
66.1 |
77.6 |
91.7 |
100.4 |
104.7 |
107.4 |
112.8 |
118.2 |
123.2 |
128.3 |
130.8 |
134.4 |
141.6 |
151.7 |
159.0 |
162.7 |
8.0 |
71.0 |
82.4 |
96.5 |
105.3 |
109.7 |
112.4 |
117.9 |
123.3 |
128.4 |
133.5 |
136.0 |
139.6 |
146.9 |
157.2 |
164.6 |
168.3 |
8.5 |
75.9 |
87.3 |
101.5 |
110.2 |
114.6 |
117.3 |
122.8 |
128.3 |
133.5 |
138.6 |
141.2 |
144.9 |
152.2 |
162.6 |
170.1 |
173.9 |
9.0 |
79.9 |
90.3 |
103.9 |
113.0 |
117.4 |
120.4 |
126.1 |
131.8 |
137.2 |
142.7 |
145.5 |
149.2 |
157.2 |
168.9 |
176.2 |
179.9 |
10.0 |
87.8 |
96.2 |
108.6 |
118.6 |
123.1 |
126.4 |
132.7 |
138.8 |
144.7 |
150.7 |
154.0 |
158.0 |
167.2 |
181.4 |
188.4 |
192.0 |
11.0 |
95.7 |
102.1 |
113.3 |
124.2 |
128.7 |
132.5 |
139.3 |
145.8 |
152.1 |
158.8 |
162.6 |
166.8 |
177.3 |
193.9 |
200.7 |
204.0 |
12.0 |
103.6 |
108.1 |
118.1 |
129.8 |
134.4 |
138.5 |
145.8 |
152.8 |
159.6 |
166.9 |
171.1 |
175.5 |
187.3 |
206.4 |
212.9 |
216.1 |
13.0 |
111.5 |
114.0 |
122.8 |
135.4 |
140.0 |
144.6 |
152.4 |
159.8 |
167.1 |
175.0 |
179.7 |
184.3 |
197.3 |
218.9 |
225.1 |
228.2 |
14.0 |
126.0 |
128.7 |
138.1 |
151.5 |
156.2 |
160.9 |
169.0 |
176.4 |
183.8 |
191.7 |
196.3 |
200.8 |
213.3 |
233.7 |
239.6 |
242.5 |
15.0 |
139.8 |
142.5 |
151.9 |
165.4 |
170.1 |
174.8 |
182.7 |
189.8 |
196.9 |
204.3 |
208.6 |
212.8 |
224.4 |
242.8 |
248.1 |
250.7 |
16.0 |
149.9 |
152.6 |
162.2 |
175.9 |
180.6 |
185.2 |
192.8 |
199.7 |
206.4 |
213.4 |
217.4 |
221.3 |
231.8 |
248.3 |
253.0 |
255.3 |
17.0 |
156.1 |
159.0 |
169.4 |
184.2 |
189.1 |
193.9 |
201.7 |
208.5 |
215.1 |
221.7 |
225.5 |
229.2 |
239.0 |
253.7 |
257.9 |
260.0 |
18.0 |
162.3 |
165.5 |
176.6 |
192.5 |
197.6 |
202.6 |
210.6 |
217.3 |
223.8 |
230.0 |
233.6 |
237.1 |
246.2 |
259.2 |
262.9 |
264.7 |
Table 5. Percentiles for the 4 x 10 m shuttle run test (sec.) in girls
Percentiles |
||||||||||||||||
Age |
1 |
3 |
10 |
20 |
25 |
30 |
40 |
50 |
60 |
70 |
75 |
80 |
90 |
97 |
99 |
100 |
5.0 |
21.1 |
20.7 |
19.4 |
18.6 |
18.2 |
17.9 |
17.4 |
16.8 |
16.3 |
15.8 |
15.6 |
15.2 |
14.4 |
13.0 |
12.6 |
12.4 |
6.0 |
20.0 |
19.6 |
18.3 |
17.5 |
17.1 |
16.9 |
16.4 |
15.9 |
15.5 |
15.0 |
14.8 |
14.4 |
13.7 |
12.6 |
12.3 |
12.1 |
7.0 |
18.9 |
18.5 |
17.2 |
16.4 |
16.0 |
15.8 |
15.4 |
15.0 |
14.6 |
14.2 |
14.0 |
13.7 |
13.0 |
12.2 |
12.0 |
11.9 |
8.0 |
17.8 |
17.4 |
16.1 |
15.4 |
15.0 |
14.8 |
14.4 |
14.0 |
13.6 |
13.3 |
13.1 |
12.9 |
12.4 |
11.7 |
11.5 |
11.4 |
9.0 |
17.0 |
16.7 |
15.5 |
15.1 |
14.5 |
14.5 |
14.1 |
13.6 |
13.4 |
13.1 |
12.8 |
12.7 |
12.1 |
11.4 |
11.2 |
11.1 |
10.0 |
16.4 |
16.1 |
15.1 |
14.8 |
14.1 |
14.2 |
13.9 |
13.3 |
13.2 |
12.8 |
12.6 |
12.5 |
11.9 |
11.3 |
11.1 |
10.8 |
11.0 |
16.2 |
16.0 |
15.2 |
14.5 |
14.2 |
14.0 |
13.6 |
13.3 |
13.0 |
12.6 |
12.5 |
12.3 |
11.9 |
10.9 |
10.6 |
10.5 |
12.0 |
15.7 |
15.6 |
14.9 |
14.2 |
13.9 |
13.7 |
13.4 |
13.0 |
12.7 |
12.4 |
12.3 |
12.1 |
11.7 |
10.6 |
10.3 |
10.2 |
13.0 |
15.2 |
15.1 |
14.6 |
13.9 |
13.7 |
13.4 |
13.1 |
12.8 |
12.5 |
12.2 |
12.1 |
11.9 |
11.5 |
10.4 |
10.1 |
9.9 |
14.0 |
15.1 |
15.0 |
14.5 |
13.8 |
13.6 |
13.4 |
13.0 |
12.7 |
12.4 |
12.1 |
12.0 |
11.8 |
11.4 |
10.3 |
10.0 |
9.8 |
15.0 |
15.0 |
14.9 |
14.4 |
13.7 |
13.5 |
13.3 |
13.0 |
12.7 |
12.4 |
12.1 |
12.0 |
11.8 |
11.4 |
10.1 |
9.8 |
9.6 |
16.0 |
14.7 |
14.6 |
14.2 |
13.6 |
13.4 |
13.2 |
12.9 |
12.6 |
12.3 |
12.1 |
11.9 |
11.7 |
11.3 |
10.0 |
9.7 |
9.5 |
17.0 |
14.5 |
14.4 |
14.0 |
13.5 |
13.4 |
13.2 |
12.9 |
12.6 |
12.4 |
12.1 |
12.0 |
11.8 |
11.4 |
10.1 |
9.8 |
9.6 |
18.0 |
14.2 |
14.1 |
13.8 |
13.4 |
13.3 |
13.2 |
12.9 |
12.6 |
12.5 |
12.1 |
12.0 |
11.9 |
11.5 |
10.2 |
9.9 |
9.7 |
Table 6. Percentiles for the 4 x 10 m shuttle run test (sec.) in boys
Percentiles |
||||||||||||||||
Age |
1 |
3 |
10 |
20 |
25 |
30 |
40 |
50 |
60 |
70 |
75 |
80 |
90 |
97 |
99 |
100 |
5.0 |
19.8 |
19.4 |
18.1 |
17.3 |
16.9 |
16.7 |
16.2 |
15.8 |
15.3 |
14.8 |
14.5 |
14.1 |
13.2 |
12.0 |
11.7 |
11.5 |
6.0 |
18.9 |
18.5 |
17.2 |
16.4 |
16.0 |
15.8 |
15.3 |
14.9 |
14.5 |
14.0 |
13.8 |
13.4 |
12.7 |
11.7 |
11.4 |
11.3 |
7.0 |
18.0 |
17.6 |
16.3 |
15.5 |
15.1 |
14.9 |
14.4 |
14.0 |
13.6 |
13.3 |
13.1 |
12.8 |
12.2 |
11.4 |
11.2 |
11.1 |
8.0 |
17.0 |
16.6 |
15.3 |
14.6 |
14.3 |
14.1 |
13.7 |
13.3 |
13.0 |
12.7 |
12.5 |
12.3 |
11.8 |
11.1 |
10.9 |
10.8 |
9.0 |
16.2 |
15.9 |
14.8 |
14.3 |
13.8 |
13.8 |
13.4 |
13.0 |
12.7 |
12.4 |
12.2 |
12.1 |
11.6 |
11.0 |
10.8 |
10.5 |
10.0 |
15.4 |
15.1 |
14.1 |
14.0 |
13.3 |
13.5 |
13.1 |
12.5 |
12.5 |
12.2 |
11.9 |
11.8 |
11.3 |
10.7 |
10.5 |
10.2 |
11.0 |
15.3 |
15.1 |
14.3 |
13.7 |
13.4 |
13.2 |
12.9 |
12.5 |
12.3 |
12.0 |
11.8 |
11.6 |
11.3 |
10.3 |
10.0 |
9.9 |
12.0 |
14.7 |
14.5 |
13.9 |
13.3 |
13.1 |
12.9 |
12.6 |
12.3 |
12.0 |
11.7 |
11.6 |
11.4 |
11.1 |
10.0 |
9.7 |
9.6 |
13.0 |
14.1 |
14.0 |
13.6 |
13.0 |
12.8 |
12.6 |
12.3 |
12.0 |
11.8 |
11.5 |
11.4 |
11.2 |
10.9 |
9.8 |
9.5 |
9.3 |
14.0 |
13.7 |
13.6 |
13.2 |
12.6 |
12.4 |
12.2 |
11.9 |
11.7 |
11.4 |
11.2 |
11.1 |
10.9 |
10.6 |
9.6 |
9.3 |
9.1 |
15.0 |
13.2 |
13.1 |
12.7 |
12.1 |
12.0 |
11.8 |
11.5 |
11.2 |
11.0 |
10.8 |
10.7 |
10.5 |
10.2 |
9.2 |
8.9 |
8.8 |
16.0 |
12.8 |
12.7 |
12.3 |
11.8 |
11.6 |
11.4 |
11.1 |
10.9 |
10.7 |
10.5 |
10.4 |
10.2 |
9.9 |
9.0 |
8.7 |
8.6 |
17.0 |
12.9 |
12.8 |
12.4 |
11.8 |
11.6 |
11.4 |
11.1 |
10.9 |
10.7 |
10.4 |
10.3 |
10.2 |
9.9 |
9.1 |
8.8 |
8.7 |
18.0 |
13.1 |
13.0 |
12.5 |
11.8 |
11.6 |
11.4 |
11.1 |
10.9 |
10.7 |
10.3 |
10.3 |
10.2 |
9.9 |
9.1 |
8.9 |
8.8 |
Table 7. Percentiles for the 20 m shuttle run test (VO2max ml/kg/min) in girls
Percentiles |
|||||||||||||||
Age |
1 |
3 |
10 |
20 |
25 |
30 |
40 |
50 |
60 |
70 |
75 |
80 |
90 |
97 |
99 |
5.0 |
44.5 |
45.1 |
46.3 |
46.8 |
47.0 |
47.2 |
47.7 |
48.2 |
48.6 |
48.9 |
49.1 |
49.5 |
50.2 |
51.3 |
52.1 |
6.0 |
42.9 |
43.7 |
44.9 |
45.6 |
46.0 |
46.3 |
46.8 |
47.4 |
47.9 |
48.4 |
48.7 |
49.1 |
50.0 |
51.3 |
52.3 |
6.5 |
42.1 |
43.0 |
44.2 |
45.1 |
45.5 |
45.8 |
46.4 |
47.0 |
47.6 |
48.2 |
48.5 |
49.0 |
49.9 |
51.3 |
52.4 |
7.0 |
41.2 |
42.2 |
43.5 |
44.5 |
45.0 |
45.3 |
46.0 |
46.6 |
47.3 |
48.0 |
48.3 |
48.8 |
49.8 |
51.4 |
52.7 |
7.5 |
40.3 |
41.4 |
42.8 |
43.9 |
44.4 |
44.8 |
45.5 |
46.2 |
47.0 |
47.7 |
48.1 |
48.7 |
49.8 |
51.6 |
53.0 |
8.0 |
39.3 |
40.5 |
42.1 |
43.2 |
43.8 |
44.2 |
45.0 |
45.8 |
46.6 |
47.5 |
47.9 |
48.5 |
49.8 |
51.8 |
53.4 |
8.5 |
38.6 |
39.6 |
41.3 |
42.6 |
43.2 |
43.6 |
44.5 |
45.4 |
46.3 |
47.2 |
47.7 |
48.4 |
49.9 |
52.1 |
53.5 |
9.0 |
38.4 |
39.2 |
41.0 |
42.4 |
43.0 |
43.5 |
44.4 |
45.3 |
46.2 |
47.2 |
47.7 |
48.4 |
49.9 |
51.9 |
53.0 |
10.0 |
37.9 |
38.4 |
40.4 |
42.0 |
42.6 |
43.2 |
44.2 |
45.1 |
46.0 |
47.0 |
47.6 |
48.2 |
49.8 |
51.6 |
52.1 |
11.0 |
35.6 |
36.2 |
38.3 |
40.1 |
40.8 |
41.4 |
42.5 |
43.5 |
44.5 |
45.7 |
46.4 |
47.0 |
48.7 |
50.8 |
51.4 |
12.0 |
33.3 |
34.0 |
36.2 |
38.2 |
38.9 |
39.6 |
40.8 |
42.0 |
43.1 |
44.3 |
45.0 |
45.7 |
47.7 |
49.9 |
50.6 |
13.0 |
31.2 |
31.9 |
34.3 |
36.4 |
37.2 |
37.9 |
39.2 |
40.4 |
41.6 |
42.9 |
43.7 |
44.4 |
46.5 |
48.9 |
49.6 |
14.0 |
29.2 |
29.9 |
32.4 |
34.6 |
35.4 |
36.2 |
37.6 |
38.8 |
40.1 |
41.4 |
42.2 |
43.0 |
45.2 |
47.7 |
48.4 |
15.0 |
27.3 |
28.0 |
30.5 |
32.8 |
33.7 |
34.5 |
35.9 |
37.2 |
38.5 |
39.9 |
40.8 |
41.6 |
43.9 |
46.4 |
47.1 |
16.0 |
25.1 |
25.9 |
28.7 |
31.1 |
32.0 |
32.8 |
34.2 |
35.6 |
37.0 |
38.4 |
39.3 |
40.2 |
42.5 |
45.3 |
46.1 |
17.0 |
23.0 |
23.9 |
26.8 |
29.3 |
30.2 |
31.1 |
32.6 |
34.1 |
35.5 |
37.0 |
37.9 |
38.8 |
41.3 |
44.1 |
44.9 |
18.0 |
20.9 |
21.8 |
24.9 |
27.5 |
28.5 |
29.4 |
31.0 |
32.6 |
34.0 |
35.6 |
36.5 |
37.4 |
40.1 |
42.9 |
43.7 |
Table 8. Percentiles for the 20 m shuttle run test (VO2max ml/kg/min) in boys
Percentiles |
|||||||||||||||
Age |
1 |
3 |
10 |
20 |
25 |
30 |
40 |
50 |
60 |
70 |
75 |
80 |
90 |
97 |
99 |
5.0 |
44.2 |
45.2 |
46.1 |
46.9 |
47.3 |
47.6 |
48.1 |
48.7 |
49.5 |
50.2 |
50.6 |
50.7 |
51.0 |
52.1 |
53.1 |
6.0 |
42.8 |
43.8 |
45.1 |
46.0 |
46.5 |
46.8 |
47.5 |
48.1 |
49.1 |
50.1 |
50.6 |
50.8 |
51.2 |
52.7 |
53.9 |
6.5 |
42.1 |
43.1 |
44.6 |
45.6 |
46.1 |
46.4 |
47.1 |
47.8 |
48.9 |
50.0 |
50.6 |
50.8 |
51.3 |
53.0 |
54.3 |
7.0 |
41.3 |
42.4 |
44.0 |
45.1 |
45.6 |
46.0 |
46.7 |
47.5 |
48.7 |
50.0 |
50.6 |
50.9 |
51.4 |
53.3 |
54.7 |
7.5 |
40.4 |
41.7 |
43.4 |
44.6 |
45.2 |
45.6 |
46.5 |
47.3 |
48.7 |
50.0 |
50.7 |
51.0 |
51.5 |
53.6 |
55.2 |
8.0 |
39.5 |
40.9 |
42.7 |
44.0 |
44.7 |
45.2 |
46.1 |
47.0 |
48.5 |
50.0 |
50.8 |
51.1 |
51.7 |
54.0 |
55.6 |
8.5 |
39.1 |
40.0 |
42.0 |
43.5 |
44.2 |
44.7 |
45.7 |
46.7 |
48.4 |
50.1 |
50.9 |
51.2 |
51.9 |
54.5 |
55.5 |
9.0 |
38.9 |
39.7 |
41.8 |
43.4 |
44.1 |
44.7 |
45.7 |
46.8 |
48.3 |
49.8 |
50.6 |
51.0 |
52.1 |
54.6 |
55.5 |
10.0 |
38.4 |
39.1 |
41.3 |
43.2 |
43.9 |
44.6 |
45.8 |
46.9 |
48.0 |
49.2 |
49.9 |
50.6 |
52.5 |
54.7 |
55.4 |
11.0 |
36.3 |
37.0 |
39.5 |
41.7 |
42.5 |
43.2 |
44.6 |
45.8 |
47.0 |
48.4 |
49.2 |
49.9 |
52.1 |
54.6 |
55.3 |
12.0 |
34.4 |
35.2 |
38.0 |
40.5 |
41.4 |
42.3 |
43.8 |
45.2 |
46.7 |
48.2 |
49.1 |
50.0 |
52.4 |
55.3 |
56.2 |
13.0 |
32.8 |
33.7 |
36.9 |
39.7 |
40.7 |
41.7 |
43.4 |
45.0 |
46.6 |
48.3 |
49.3 |
50.3 |
53.1 |
56.3 |
57.2 |
14.0 |
31.3 |
32.3 |
35.8 |
38.8 |
39.9 |
41.0 |
42.9 |
44.6 |
46.4 |
48.3 |
49.4 |
50.5 |
53.5 |
57.0 |
58.0 |
15.0 |
29.6 |
30.7 |
34.5 |
37.8 |
39.0 |
40.1 |
42.1 |
44.0 |
45.9 |
47.9 |
49.1 |
50.2 |
53.4 |
57.2 |
58.3 |
16.0 |
28.2 |
29.3 |
33.2 |
36.6 |
37.9 |
39.1 |
41.3 |
43.2 |
45.2 |
47.3 |
48.6 |
49.8 |
53.3 |
57.2 |
58.3 |
17.0 |
26.4 |
27.7 |
32.0 |
35.6 |
36.9 |
38.2 |
40.5 |
42.6 |
44.7 |
46.9 |
48.2 |
49.5 |
53.2 |
57.4 |
58.6 |
18.0 |
24.7 |
26.0 |
30.8 |
34.6 |
36.0 |
37.3 |
39.7 |
42.0 |
44.2 |
46.5 |
47.9 |
49.2 |
53.1 |
57.6 |
58.9 |
The combined percentile curves for handgrip strength, standing long jump, 4x10m SRT, and 20m SRT are presented for both girls and boys in Figures 1-8.
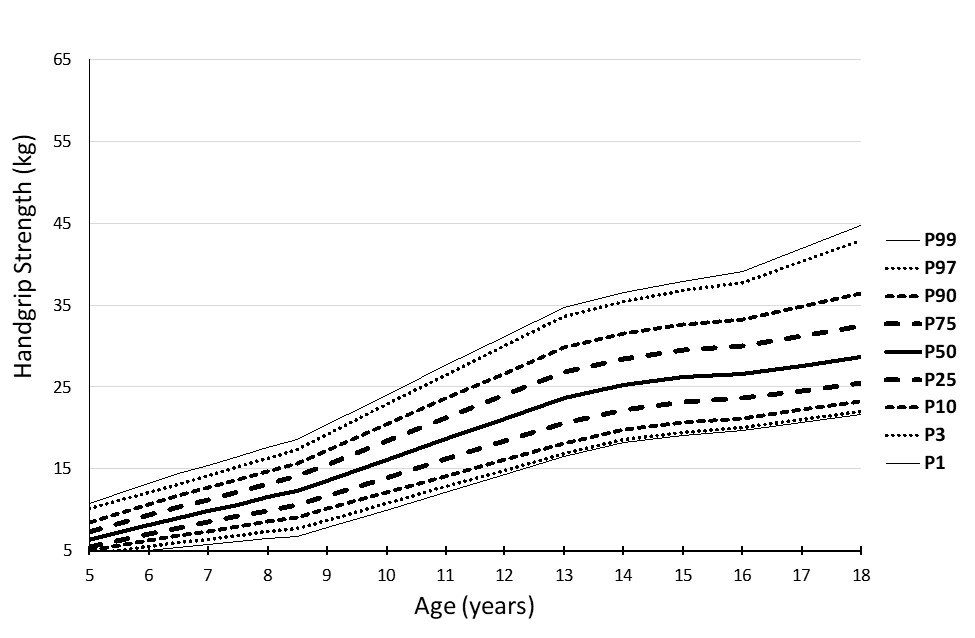 |
Figure 1: Percentile curves for the handgrip strength (kg) in girls
(Average of right and left handgrip strength)
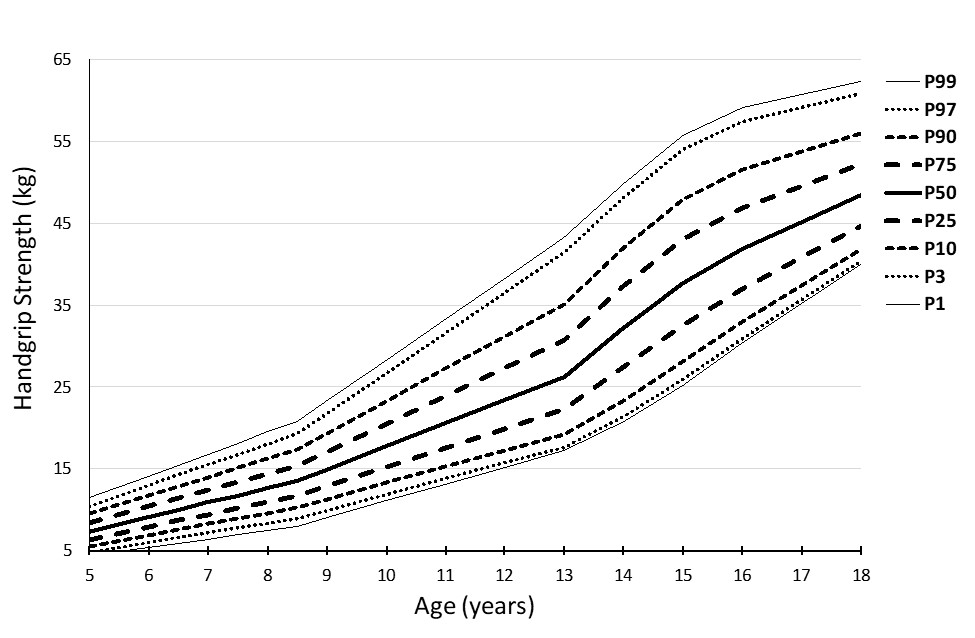 |
Figure 2: Percentile curves for the handgrip strength (kg) in boys
(Average of right and left handgrip strength)
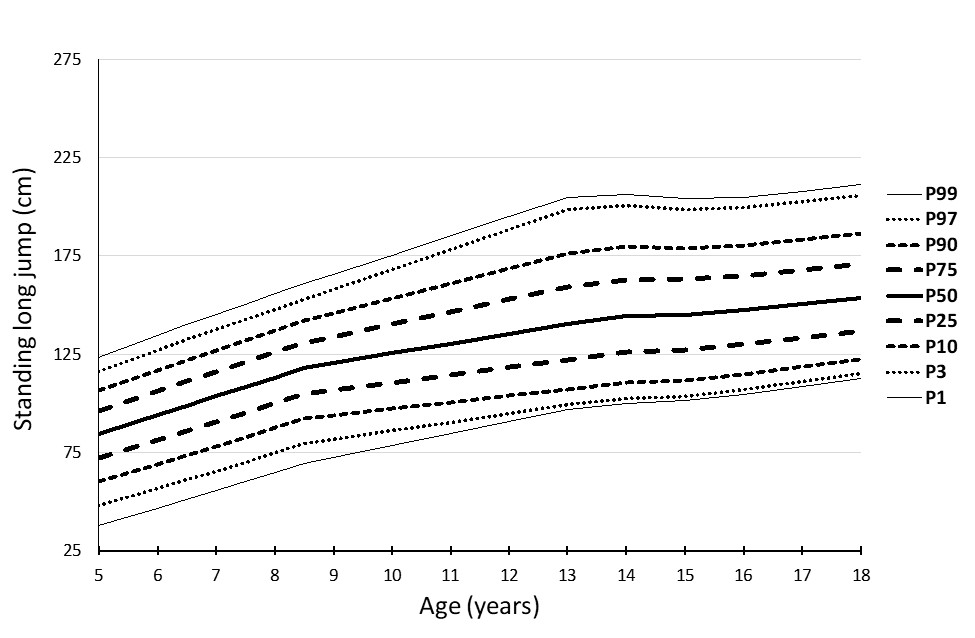 |
Figure 3: Percentile curves for the standing long jump test (cm) in girls
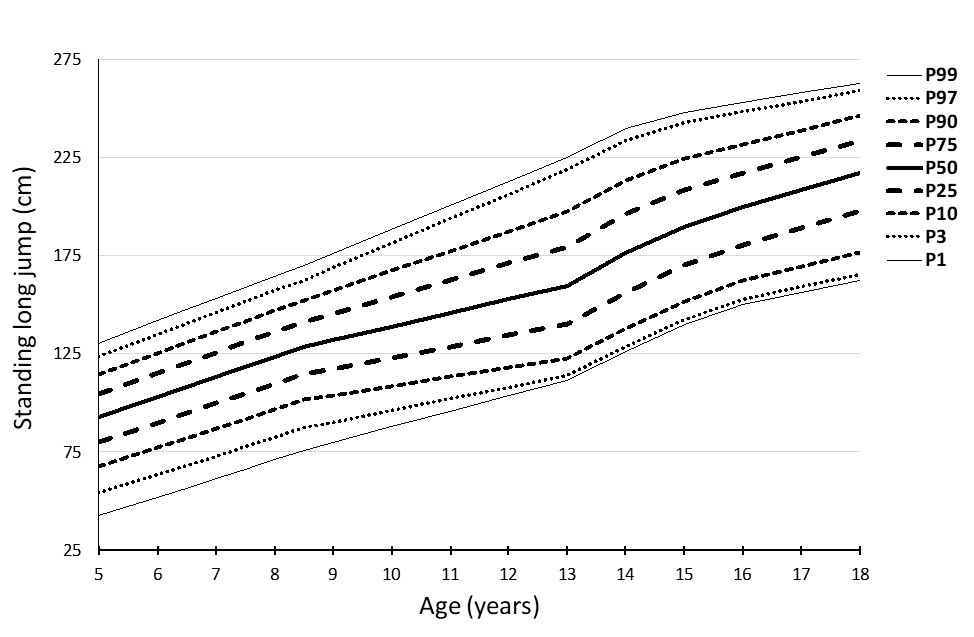 |
Figure 4: Percentile curves for the standing long jump test (cm) in boys
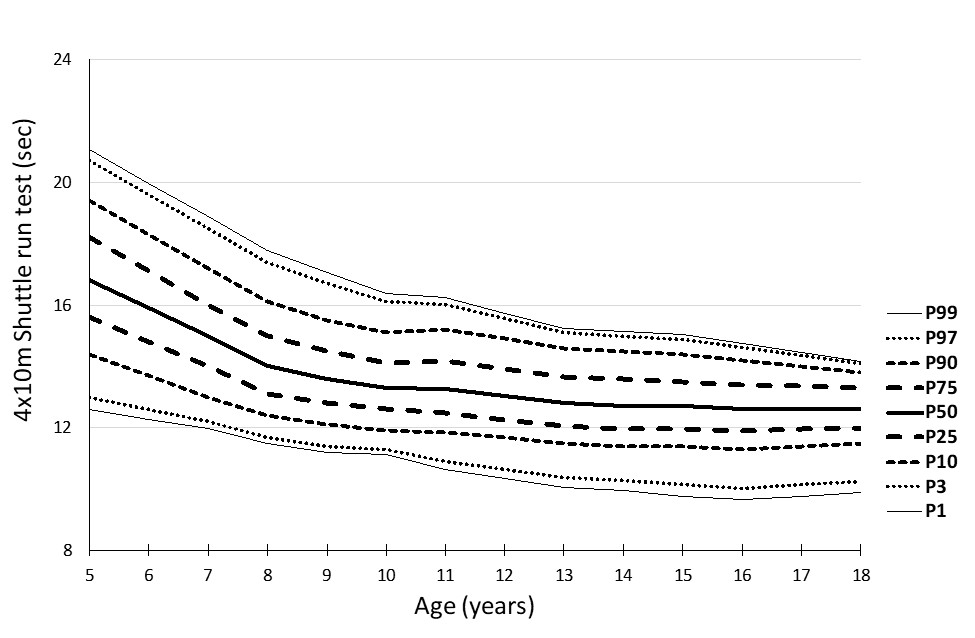 |
Figure 5: Percentile curves for the 4 x 10 m shuttle run test (sec) in girls
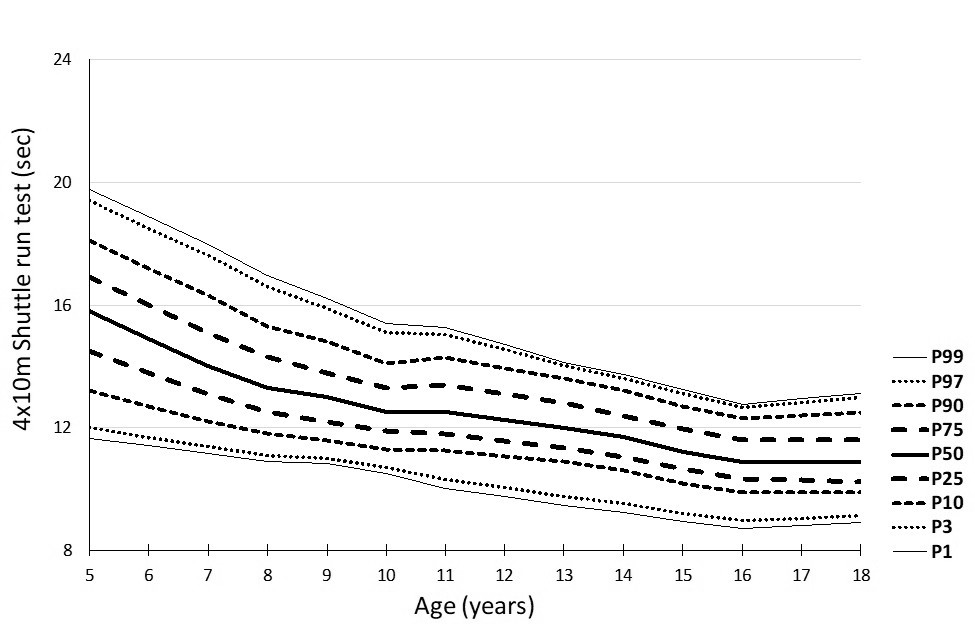 |
Figure 6: Percentile curves for the 4 x 10 m shuttle run test (sec) in boys
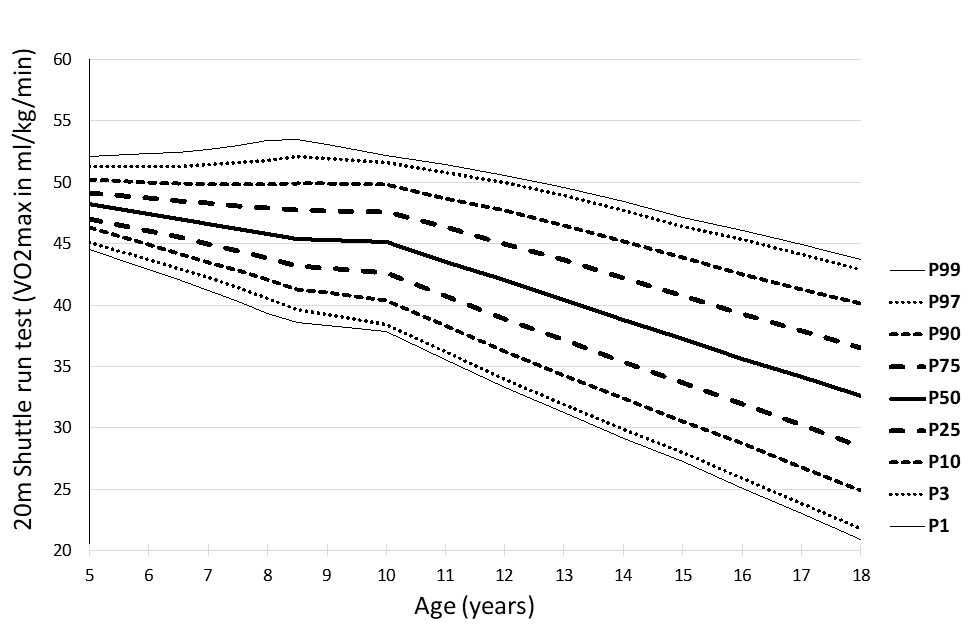 |
Figure 7: Percentile curves for the 20 m shuttle run test
(VO2max ml/kg/min) in girls
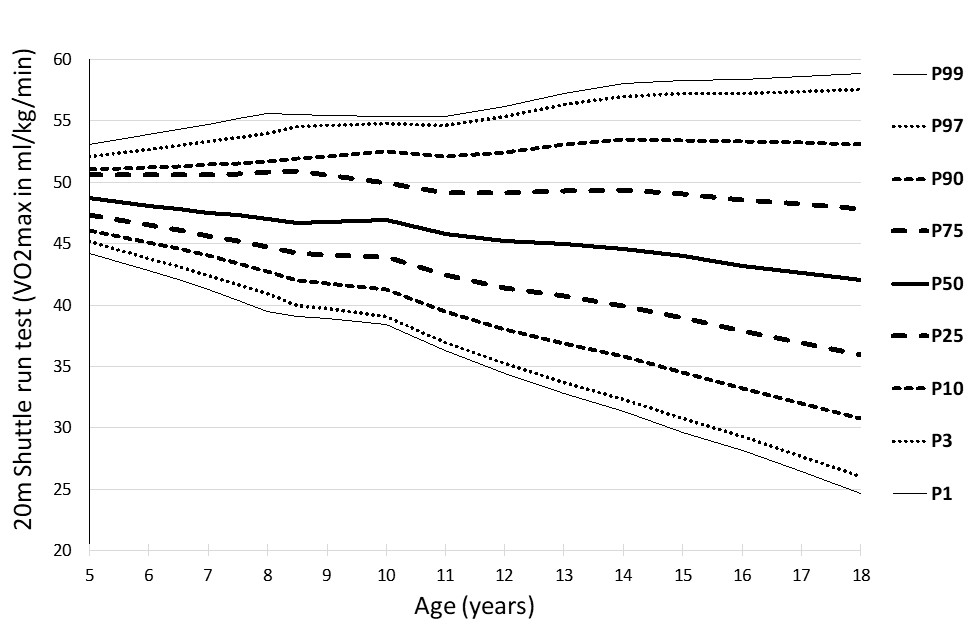 |
Figure 8: Percentile curves for the 20 m shuttle run test
(VO2max ml/kg/min) in boys
4. DISCUSSION
The percentile curves showed linearity, which sharpens between the ages of 9 and 13, and is probably connected with puberty.
Studies which are conducted in order to obtain physical fitness percentile scores require a considerable amount of time and financial support due to the need to cover large numbers of participants. For instance, the HELENA study (Healthy Lifestyle in Europe by Nutrition in Adolescence) established percentile scores for a wide set of physical fitness components in adolescents from nine different European countries, and consisted of a total of 3 528 participants (1683 boys and 1845 girls) (F. Ortega et al., 2011). The IDEFICS study (identification and prevention of dietary and lifestyleinduced health effects in children and infants) obtained percentile scores based on a large sample of children from eight European countries, consisting of 18 745 participants (9 456 boys and 9 289 girls) in total (Miguel-Etayo et al., 2014). Furthermore, Tomkinson et al.’s percentile scores for VO2max (obtained by the 20 m shuttle run test) were established as a result of the combination of different studies from more than 50 countries, and included a total of 1 142 026 children and adolescents (Tomkinson et al., 2016).
Based on these significant efforts and resources, which are needed to establish percentile scores, we are of the opinion that the most appropriate way to obtain percentile scores for the absent years, which can be applied until another large study fills these gaps, is through appropriate interpolations and extrapolations of the existing data.
5. CONCLUSION
The proposed combined and interpolated reference values can be applied in order to evaluate European children and adolescents at all ages until the missing values are established by experimental research.
Acknowledgements: Data from this study was originally presented at the 13th European & 29th World FIEP Congress in Istanbul, Turkey, in 2018. After this Congress, the study was built upon further and the complete article was accepted in the European Journal of Physical Education and Sport Science.
This research was financially supported by Grant ‘08/15.02.2018’ from the National Sports Academy, Sofia, Bulgaria.
REFERENCES
ALPHA. (2009). The ALPHA Health-related Fitness Test battery for Children and Adolescents, Test Manual.
Castro-Pinero. J., E. Artero, V. Espana-Romero, F. Ortega, M. Sjostrom, J. Suni, & Ruiz, J. (2009). Criterion-related validity of field-based fitness tests in youth: A systematic review. . Br J Sports Med, 44, 934-943.
Cvejic, D., T. Pejovic, & Ostojic, S. (2013). Assessment of physical fitness in children and adolescents. Physical Education and Sport, 11(2), 135-145.
Ganley, K.J., Paterno, M.V., Miles, C., Stout, J., Brawner, L., Girolami, G., & Warren, M. (2011). Health-related fitness in children and adolescents. Pediatr Phys Ther, 23(3), 208-220. doi: 10.1097/PEP.0b013e318227b3fc
Kolimechkov, S. (2017). Physical Fitness Assessment in Children and Adolescents: A Systematic Review. European Journal of Physical Education and Sport Science, 3(4), 65-78.
Miguel-Etayo, P., L. Gracia-Marco, F. Ortega, T. Intemann, R. Foraita, L. Lissner, Moreno., L. (2014). Physical fitness reference standards in European children: the IDEFICS study. International journal of Obesity, 38, 57-66.
Ortega, F., E. Artero, J. Ruiz, V. España-Romero, D. Jiménez-Pavón, G. VicenteRodriguez, . . . Castillo, M. (2011). Physical fitness levels among European adolescents: the HELENA study. British Journal of Sports Medicine, 45, 20-29.
Ortega, F.B., Ruiz, J.R., Castillo, M.J., & Sjostrom, M. (2008). Physical fitness in childhood and adolescence: a powerful marker of health. Int J Obes (Lond), 32(1), 1-11. doi: 10.1038/sj.ijo.0803774
Ruiz, J., J. Castro-Pinero, V. Espana-Romero, E. Artero, F. Ortega, M. Cuenca, . . . Castillo, M. (2010). Field-based fitness assessment in young people: the ALPHA health-related fitness test battery for children and adolescents. Br J Sports Med.
Santos, R., & Mota, J. (2011). The ALPHA health-related physical fitness test battery for children and adolescents. Nutr. Hosp., 26(6), 1199-1200.
Tomkinson, G.R., Lang, J.J., Tremblay, M.S., Dale, M., LeBlanc, A.G., Belanger, K., . . . Leger, L. (2016). International normative 20 m shuttle run values from 1 142 026 children and youth representing 50 countries. Br J Sports Med. doi: 10.1136/bjsports-2016-095987
Full Text: Alpha-fit test battery norms for children and adolescents from 5 to 18 years of age obtained by a linear interpolation of existing European physical fitness references. European Journal of Physical Education and Sport Science
Available on the official website of the Journal
This article is also available on ResearchGate
Authors
Stefan Kolimechkov PhD
Elite Gymnastics Academy CIC, London, United Kingdom
Academia.edu | ORCID | Research Gate | Google Scholar
Corresponding author: dr.stefan.kolimechkov@gmail.com
Associate Professor Dr Lubomir Petrov PhD
Department of Physiology and Biochemistry, National Sports Academy, Sofia, Bulgaria
Academia.edu | ORCID | Research Gate | Google Scholar
e-mail:
dr.lubomir.petrov@gmail.com
Associate Professor Albena Alexandrova PhD
Department of Physiology and Biochemistry, National Sports Academy, Sofia, Bulgaria
Academia.edu | ORCID | Research Gate | Google Scholar
e-mail: a_alexandrova_bas@yahoo.com
ISSN: 2501 - 1235
How to cite this article:
Kolimechkov, S., Petrov, L., & Alexandrova, A. (2019). Alpha-fit test battery norms for children and adolescents from 5 to 18 years of age obtained by a linear interpolation of existing European physical fitness references. European Journal of Physical Education and Sport Science, 5(4), 1-14.
